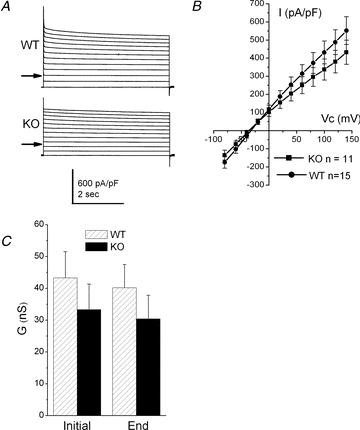
Figure 3. Total steady state whole cell currents in WT and KO proximal tubule cells.

A, typical traces obtained from WT (upper) and KO (lower) recordings. Clamp potential was stepped from −80 mV to between +140 and −80 mV. The arrows indicate the zero current level. B, mean I–V curve of total current in WT (▪, n = 15) and KO recordings (•, n = 11). C, mean conductance in WT and KO recordings initially on stepping the potential and at the end of the potential step.
