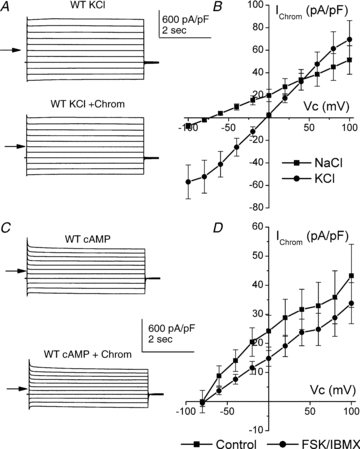
Figure 7. Relative permeability of 100 μm chromanol-sensitive conductances and effect of cAMP activation.

A, typical traces from a WT recording in the presence of bath KCl (upper) and KCl plus chromanol (lower). B, mean I–V curve of chromanol-sensitive currents in paired cells in the presence of Na+ bath solution (▪) or K+ bath solution (•) (n = 7). C, typical traces from a WT tubule previously stimulated with FSK (10 μm) and IBMX (100 μm). In the upper trace the bath contained high Na+, while in the lower trace it contained high Na+ plus chromanol. D, mean I–V curve of chromanol-sensitive currents in cells under the control condition (▪) (n = 13) or after cells had been incubated with FSK (10 μm) and IBMX (100 μm) for 30 min (•) (n = 15). Under both conditions the bath contained high Na+. Mean currents were recorded at the end of the potential step.
