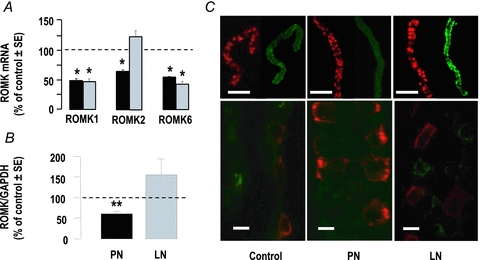
Figure 5. Expression of ROMK.

A, quantitative RT-PCR analysis of ROMK1, ROMK2 and ROMK6 mRNA expression in CCDs from nephrotic (black columns) and sodium-depleted rats (grey columns). Results were calculated as a function of tubular length and were expressed as per cent of mean controls. Values are means ± SEM from 11 animals; *P < 0.005 as compared to controls. B, immunoblot analysis of ROMK in CCDs from control, nephrotic (PN) and sodium-depleted (LN) rats. Results were calculated as ratios of ROMK over GAPDH and were expressed as per cent of mean controls in each experiment. Values are means ± SEM from 7 animals; **P < 0.001 as compared to controls. C, immuno-labelling of ROMK (green) and anion exchanger AE1 utilized as a specific marker of collecting ducts (red) in CCDs isolated from control, PN and LN rats. Scale bars: 100 μm and 10 μm for top and bottom images, respectively.
