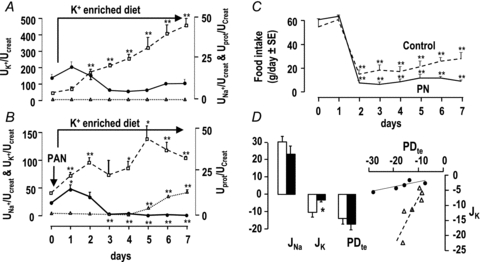
Figure 8. Handling of potassium in potassium-loaded rats.

A and B, time course of urinary excretion (U) of sodium (filled circles, continuous line), potassium (open squares, dashed lines) and protein (filled triangles, dotted lines) in control (A) and nephrotic rats (B) fed a potassium-enriched diet. Nephrotic syndrome was induced by a single injection of PAN at the beginning of day 1, and potassium loading was started on the same day by feeding a K+-enriched diet. Sodium, potassium and protein excretion is expressed as a function of creatinine excretion. Data are means ± SEM from 6 animals in each group. C, daily food intake in control (dashed line) and nephrotic rats (continuous line) fed a potassium-enriched diet. *P < 0.05 and **P < 0.005 as compared to day 0. D, fluxes of Na+ (JNa) and K+ (JK), transepithelial voltage (PDte), and relationship between JK and PDte in microperfused CCDs from control (open columns and symbols) and nephrotic rats (filled columns and symbols) fed a potassium-enriched diet. JNa and JK are in pEq mm−1 min−1, and PDte is in mV. Values are means ± SEM from 6 control and 5 nephrotic rats. *P < 0.05 as compared to controls.
