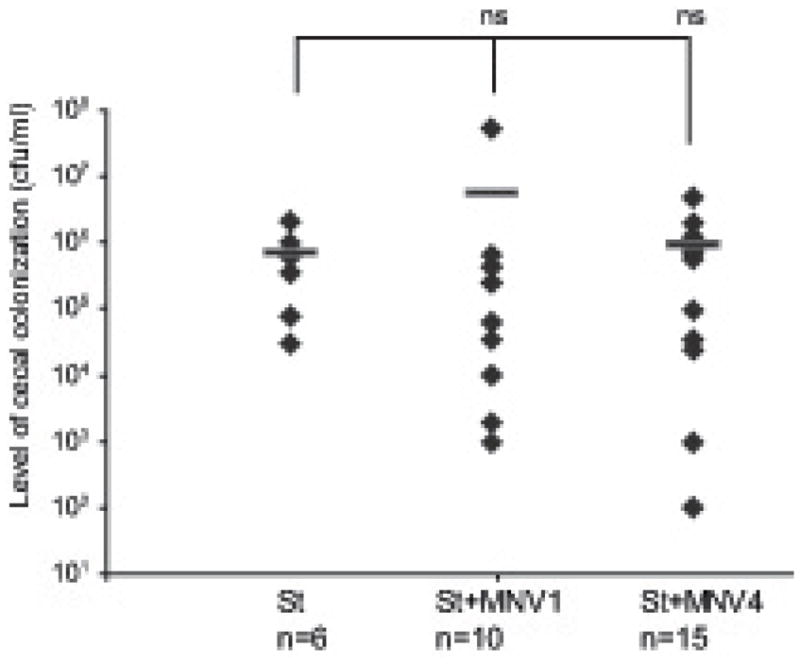
Figure 1. S. typhimurium colonization of the mouse cecum in the presence or absence of MNV1 or MNV4.

The S. typhimurium loads were determined by plating 100 μl of cecal contents onto LB/streptomycin plates. S. typhimurium colonization is expressed as cfu/ml volume of cecal contents and the mean cfu of each experimental group is indicated by a horizontal line. Each diamond represents the data from an individual animal and the total number (n) of animals per experimental group is indicated. St = S. typhimurium infected animals; St + MNV1 = S. typhimurium and MNV1 co- infected animals; St + MNV4 = S. typhimurium and MNV4 co-infected animals; ns = not statistically significant (p≥0.05) compared to no St.
