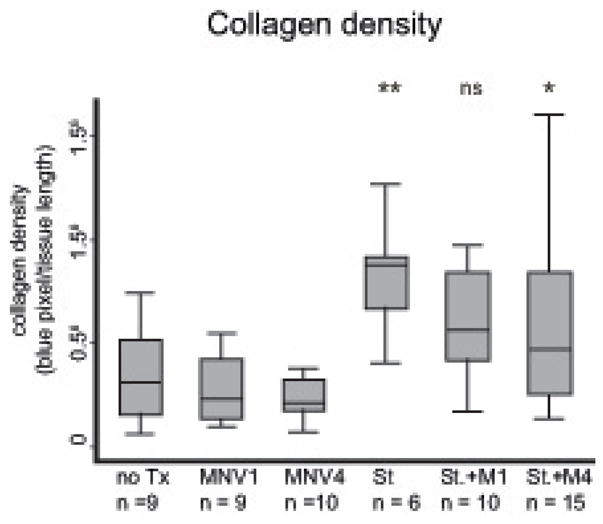
Figure 5. Collagen deposition in the cecum.

Collagen density was determined from digital images of an entire cross-section of cecal tissue from each animal and normalized to the length of tissue. Results are from three independent animal experiments.
n = number of animals per experimental group, not significant (ns) = p≥0.05, * p < 0.05, ** p < 0.01, *** p < 0.001 compared to no Tx.
