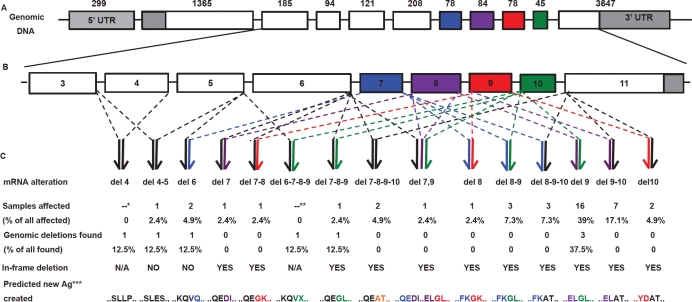
Figure 1.
(A) The genomic structure of FAM190A, NM_001145065. Each box represents an exon, numbers above indicate their nucleotide lengths. Grey indicates the UTR; white and colors, the exons having nucleotide lengths not divisible and divisible by 3, respectively. (B) A magnification of exons from 3 to 11. (C) Top to bottom: structural types of the intragenic deletions, percentage of samples (combined panels) affected, percentage of homozygous deletions at the genomic level, type of rearranged transcripts, and predicted aminoacidic sequences at the transcript rearrangement joints. *cDNA not examined. **Lack of a PCR product in cDNA from exons 6 to 11. ***Predicted new antigen at the joint between normally non-contiguous exons

