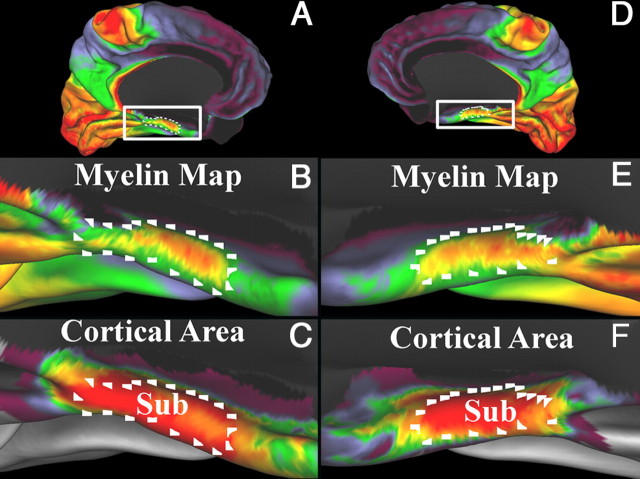
Figure 12.
A–F, Myelin maps (B, E) and probabilistic cortical area (C, F) from Amunts et al. (2005) on a cortical midthickness surface. Left hemisphere is shown in A–C, and right hemisphere is shown in D–F. The probabilistic area of the subiculum complex (Sub) is centered on the region of heavier myelination on the parahippocampal gyrus. The white marks are in the same locations in each panel within a hemisphere.

