
Figure 5.
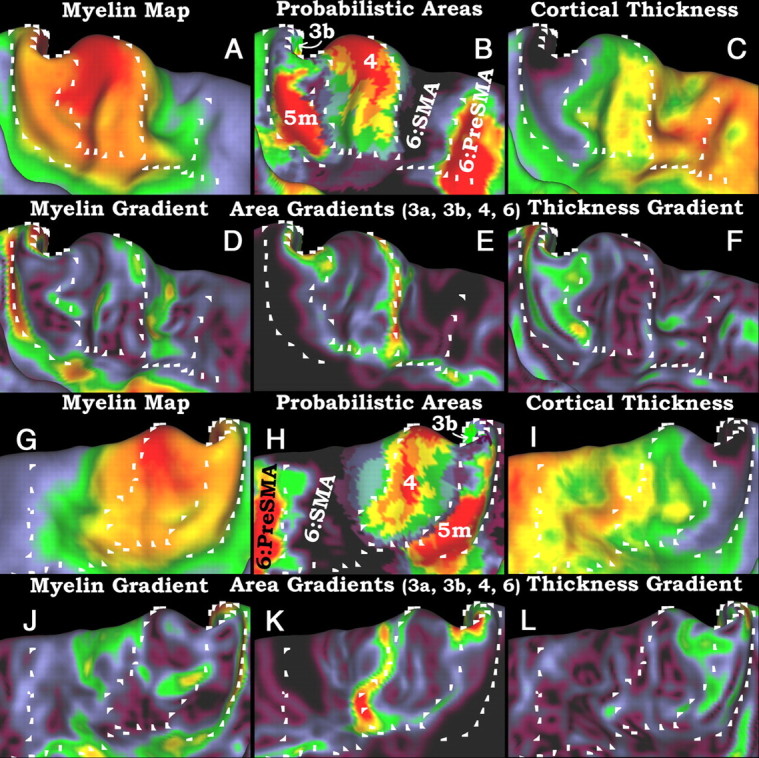
A–L, A comparison of myelin maps and their gradients to probabilistic cortical areas and their gradients and also to cortical thickness maps and their gradients. The top two rows (A–F) show the left paracentral lobule, and the bottom two rows (G–L) show the right paracentral lobule. A and G are myelin maps; D and J are myelin gradients; and B and H are probabilistic cytoarchitectonic maps of areas 3b, 4, and 5m. Area 6 is divided into SMA and pre-SMA by a diffusion tractography-based parcellation (Johansen-Berg et al., 2004), and only pre-SMA is shown for clarity. E and K are the sum of the gradients of areas 3b, 3a, 4, and 6. C and I are cortical thickness maps corrected for surface curvature. F and L are thickness gradients. As in Figure 4, the white marks are in the same positions in each panel.