
Figure 6.
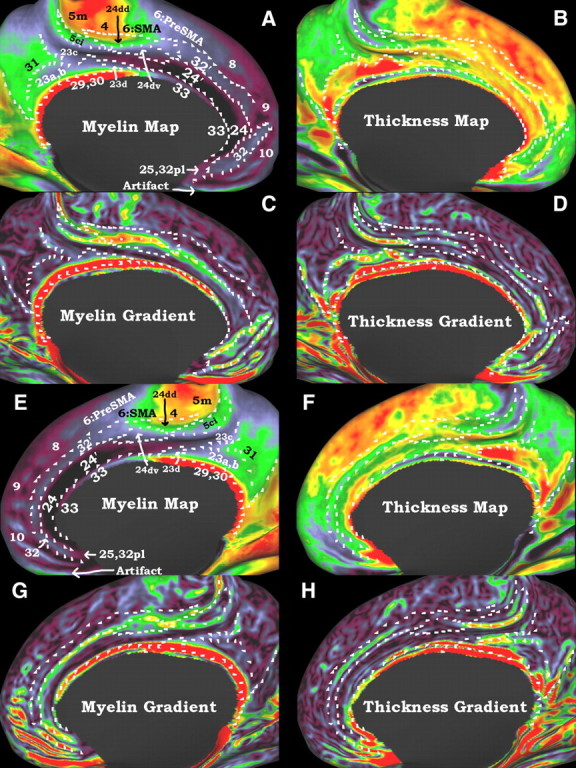
A–H, Myelin and thickness maps and their gradients are used to define putative cortical areas in the cingulate region on an inflated surface. White marks are in the same positions within each hemisphere and were drawn on either the myelin gradients, the thickness gradients, or the inferior borders of probabilistic areas 4 and 6 (data not shown). The top two rows (A–D) are the left hemisphere and the bottom two rows (E–H) are the right hemisphere. A and E show the myelin maps, B and F show the cortical thickness maps corrected for surface curvature, C and G show the myelin gradients, and D and H show the thickness gradients.