
Figure 7.
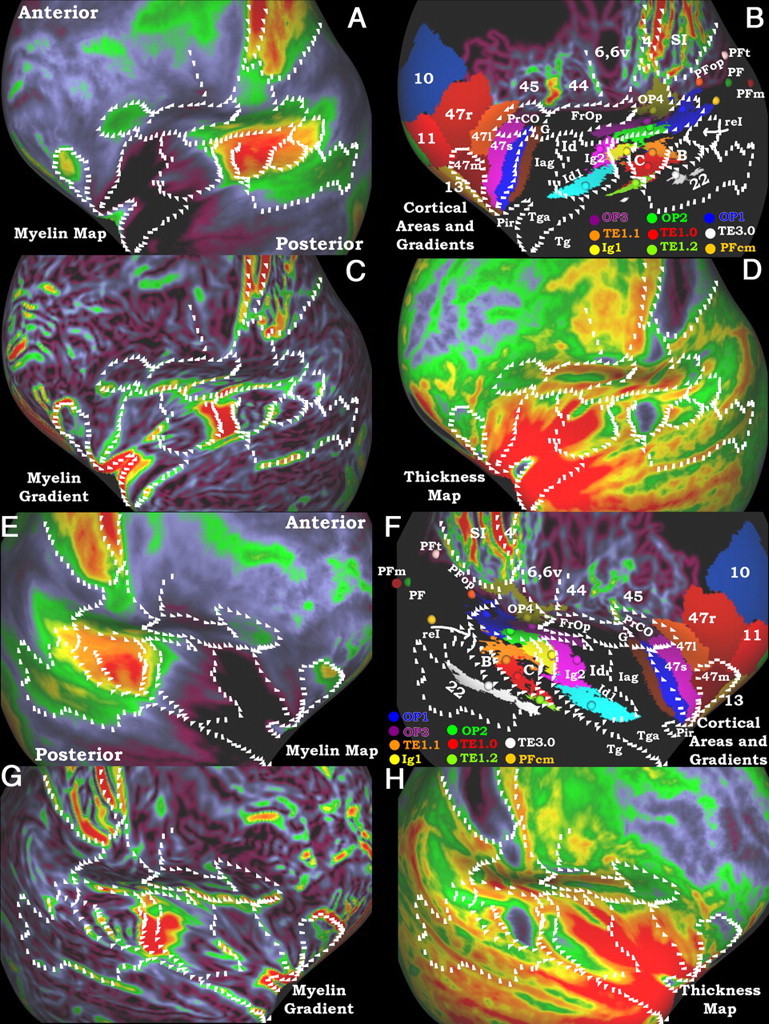
A–H, Myelin maps, gradients of myelin maps, and thickness maps are compared with cortical areas and gradients of cortical areas in the perisylvian region on an inflated surface. White marks are in the same positions within each hemisphere and were drawn on the myelin gradients and gradients of probabilistic areas. The top two rows (A–D) are the left hemisphere and the bottom two rows (E–H) are the right hemisphere. A and E show the myelin maps. B and F include the gradients of the probabilistic areas in Figure 4 and the gradients of surface mapped areas 44 and 45. The orbito-frontal parcellation was derived from surface mapped architectonic parcels from the 4 hemispheres presented by Öngür et al. (2003). The spheres and associated colored patches are 3D centers of gravity of volume mapped cortical areas and a hard segmentation of the volume mapped cortical areas thresholded at 4 subjects from the SPM anatomy toolbox (Eckhoff et al., 2005a). C and G show the myelin gradients. D and H show the cortical thickness maps corrected for surface curvature. Note that Tga is more lightly myelinated than Tg, but the difference is not visible in A and E because both are extremely lightly myelinated compared with the rest of the brain.