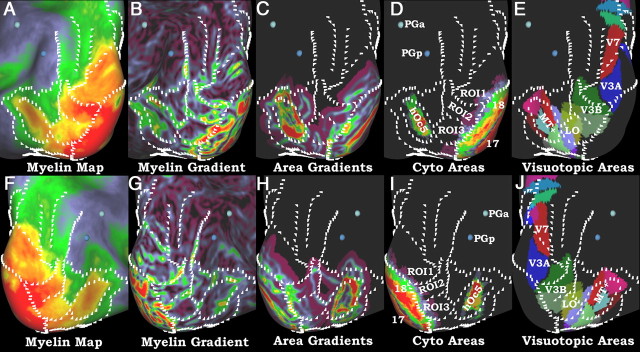
Figure 8.
A–J, Myelin maps, gradients of myelin maps, cytoarchitectonic areas, gradients of cytoarchitectonic areas, and visuotopic areas of the lateral visual cortex on an inflated surface. Because of increased variability of the gradients within this region, white marks were drawn on a map of left × right myelin gradients, which highlights gradients that are consistent across hemispheres and are in the same positions in all images. For the area18 border, the left × right gradient of area 18 was used, as myelin maps become unreliable in this region. The top row (A–E) is the left hemisphere and the bottom row (F–J) is the right hemisphere. A and F show the myelin maps, B and G show the gradients of the myelin maps, C and H show gradients of the cortical areas shown in D and I (17, 18, and hOc5; Amunts et al., 2000; Malikovic et al., 2007), and E and J show the visuotopic areas from Kolster et al. (2010), Swisher et al. (2007), and V6 of Pitzalis et al. (2006). Two volumetrically mapped probabilistic areas (PGa and PGp; Caspers et al., 2006, 2008) are shown as 3D centers of gravity. For the visuotopic maps, areas V1, V2, and V3 were not shown because they do not align with the histologically defined areas (D. C. Van Essen, M. F. Glasser, D. L. Dierker, J. Harwell, and T. Coalson, unpublished observations).

