
Figure 2.
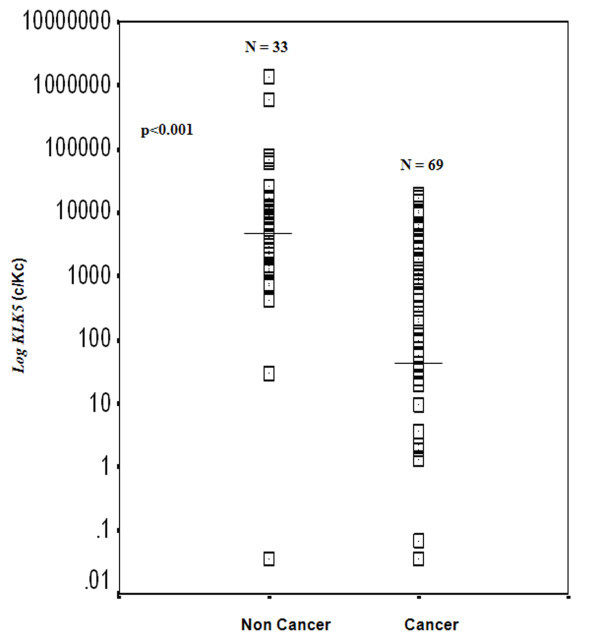
Distribution of KLK5 mRNA expression levels of the cancerous and the non-cancerous breast tissue specimens. Horizontal lines indicate the median (50th percentile) KLK5 expression. The p value was calculated using the Mann-Whitney U test.
Official websites use .gov
A
.gov website belongs to an official
government organization in the United States.
Secure .gov websites use HTTPS
A lock (
) or https:// means you've safely
connected to the .gov website. Share sensitive
information only on official, secure websites.
Distribution of KLK5 mRNA expression levels of the cancerous and the non-cancerous breast tissue specimens. Horizontal lines indicate the median (50th percentile) KLK5 expression. The p value was calculated using the Mann-Whitney U test.