Figure 2.

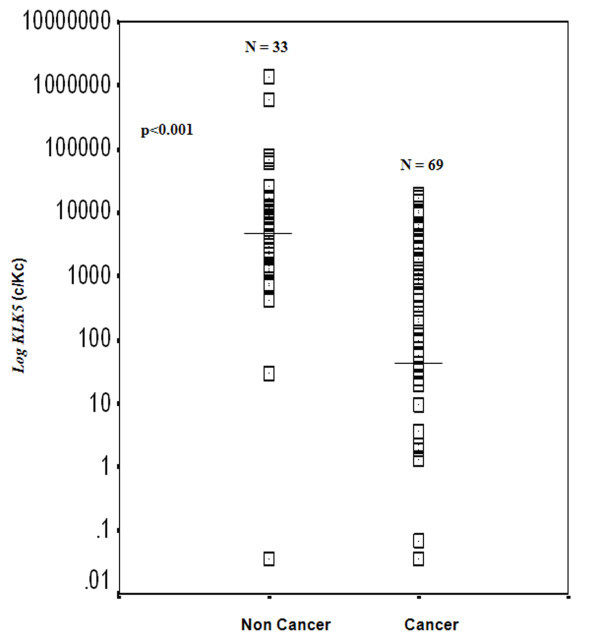
Distribution of KLK5 mRNA expression levels of the cancerous and the non-cancerous breast tissue specimens. Horizontal lines indicate the median (50th percentile) KLK5 expression. The p value was calculated using the Mann-Whitney U test.

Distribution of KLK5 mRNA expression levels of the cancerous and the non-cancerous breast tissue specimens. Horizontal lines indicate the median (50th percentile) KLK5 expression. The p value was calculated using the Mann-Whitney U test.