
Figure 3.
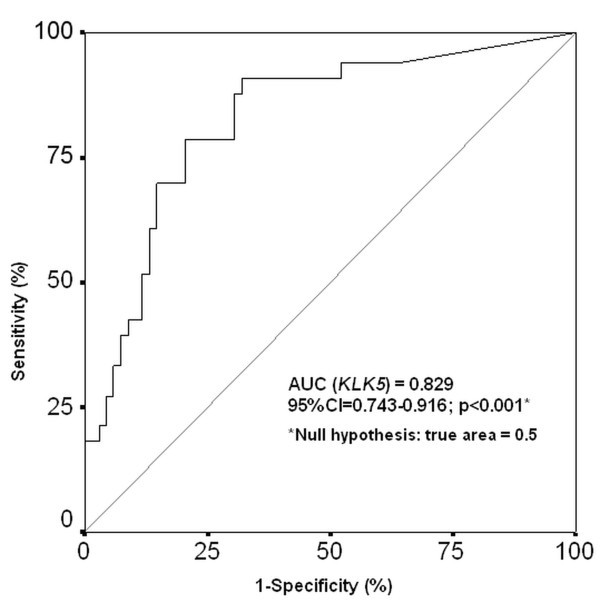
ROC analysis of the KLK5 expression quantification in breast cancer prediction. The area under the ROC curves (AUC) was analyzed by Hanley and McNeil method.
Official websites use .gov
A
.gov website belongs to an official
government organization in the United States.
Secure .gov websites use HTTPS
A lock (
) or https:// means you've safely
connected to the .gov website. Share sensitive
information only on official, secure websites.
ROC analysis of the KLK5 expression quantification in breast cancer prediction. The area under the ROC curves (AUC) was analyzed by Hanley and McNeil method.