
Figure 2.
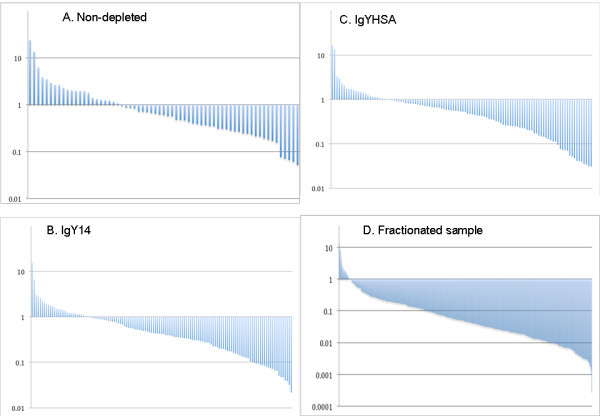
Dynamic range of protein abundance. Abundance of each identified protein was calculated with APEX algorithm. Abundance is plotted on log scale spanning 4 orders of magnitude. Proteins with an APEX value below 0.1log are considered LAP. Data shown were obtained from one typical set of data for each depletion method. A: non-depletion; B: IgY14-depletion; C: IgYHSA-depletion. D: IgYHSA-depletion and RP-fractionation.