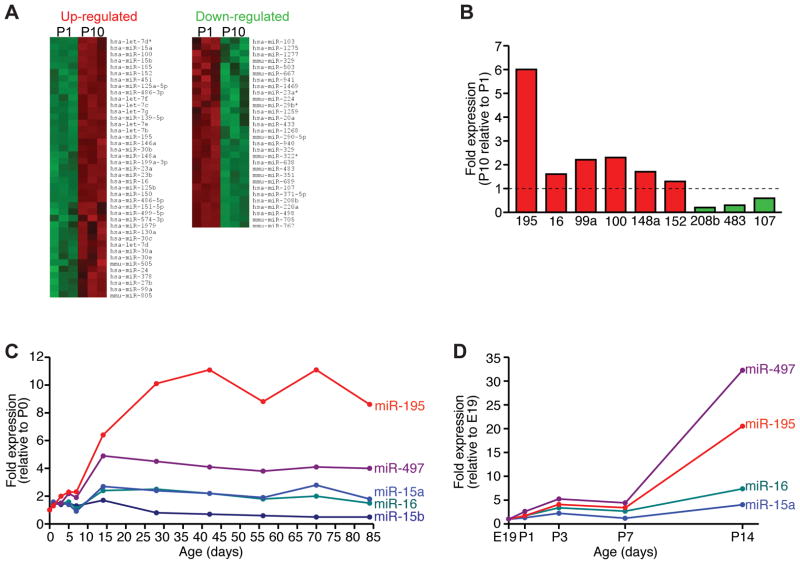
Figure 1. MicroRNA expression profiling during post-natal cardiac development.
A, Heat map showing microRNAs that are either up- or down-regulated in the heart between post-natal days 1 and 10 (P1 and P10) in the mouse. B, Real-time PCR analysis for a subset of microRNAs that are regulated during post-natal cardiac development. miR expression levels are normalized to U6 and represented as a fold change relative to P1 ventricles. C, Temporal regulation of miR-15 family members in the heart during post-natal cardiac development. Expression levels of each miR-15 family member are normalized to U6 and represented as a fold change relative to P0 ventricles. D, Temporal regulation of miR-15 family members in isolated cardiomyocytes. Expression levels of each miR-15 family member are normalized to U6 and represented as a fold change relative to E19 cardiomyocytes.

