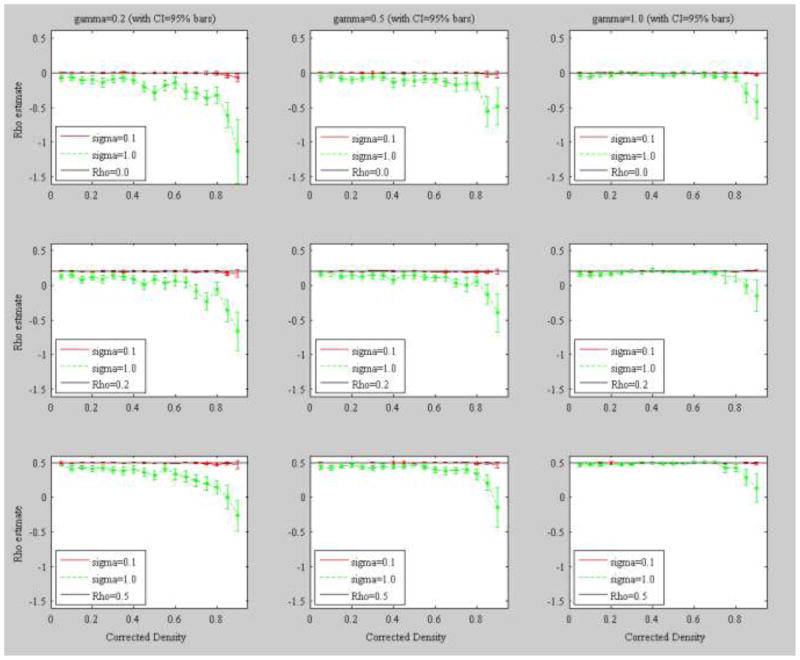
Figure 3.
Mean plots of the estimated autocorrelation parameter ρ among 100 replications against each level of density in C (Δ(c)) at each level of population γ. Bars represent upper and lower bounds of the 95% confidence interval around the mean. Asterisks indicate that the upper bound of the 95% confidence interval falls below the given population value of ρ. Event size was specified as 10 (K=10). Δ(c)={0.05, 0.10, 0.15, 0.20, 0.25, 0.30, 0.35, 0.40, 0.45, 0.50, 0.55, 0.60, 0.65, 0.70, 0.75, 0.80, 0.85, 0.90} where the corresponding estimated λ values are {1.80, 2.56, 3.16, 3.65, 4.10, 4.54, 4.93, 5.29, 5.66, 6.03, 6.35, 6.69, 7.07, 7.48, 7.81, 8.18, 8.61, 9.06}.

