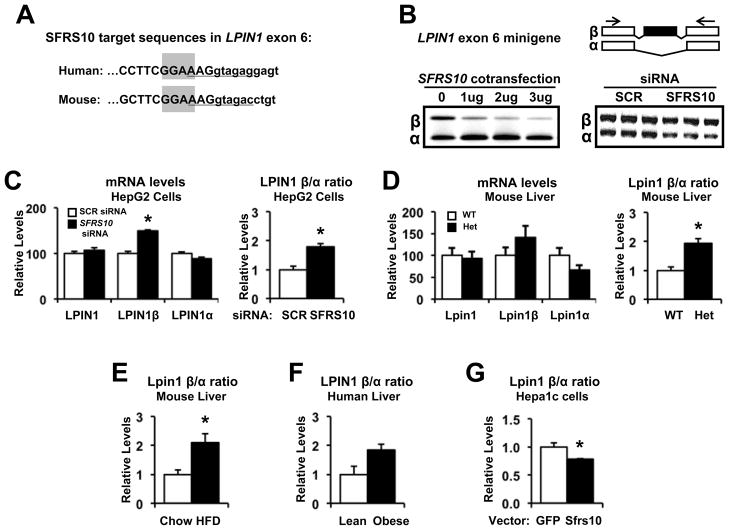
Figure 4. SFRS10 regulates LPIN1 splicing.
(A) The putative binding site of SFRS10, GGAA, is highlighted in gray within alternatively spliced exon 6 sequence (Ensembl release 61) of human and mouse LPIN1. The U1 snRNA binding site at the 5’ splice site is underlined. (B) SFRS10 cotransfection increases exclusion of LPIN1 exon 6 in a minigene system (left), while SFRS10 siRNA increases inclusion (right). PCR primers are shown as arrows. (C–D) Expression of total LPIN1, LPIN1β and LPIN1α isoforms was determined (RT-PCR) in: (C) HepG2 cells after SCR (white bars) or SFRS10 siRNA (black bars), and (D) liver samples from WT (white, n=7) and Sfrs10 heterozygous (black, n=5) mice. (E–G) Expression of Lpin1β relative to Lpin1α was measured by RT-PCR in liver from: (E) HFD (black, n=6) and chow (white, n=6) mice, (F) lean (white, n=6) or obese (black, n=14) humans, and (G) Hepa1c cells after GFP (white, n=5) or SFRS10 (black, n=5) overexpression. Data are mean±SEM. *, p<0.05 vs. control. See Fig S2.

