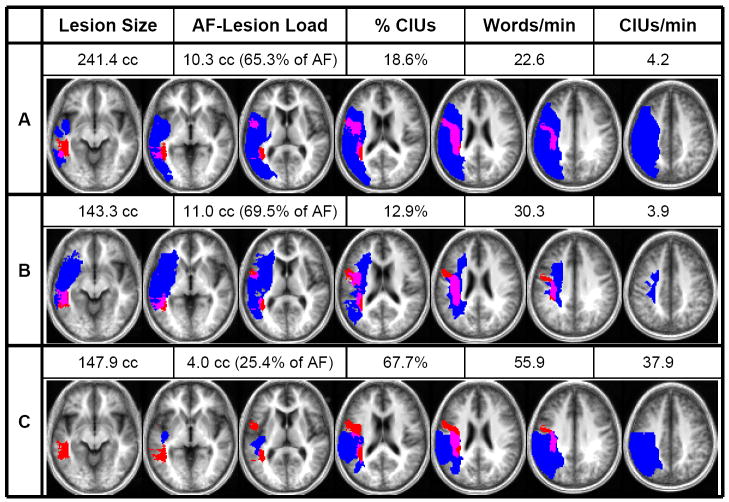
Figure 3. Lesion–DTI fiber tract overlap.
Shown here are examples of three patients’ behavioral scores, lesion sizes, and AF-lesion loads, as well as their individual lesion maps (depicted in blue) overlaid onto the probabilistic AF map (depicted in red). Overlap between lesion and AF is displayed in purple. The axial slices depicted correspond to z=−10, −2, 8, 18, 26, 34, and 42 in Talairach space.
Comparison of patients A and B shows how two patients can display comparable AF-lesion loads and behavioral scores despite drastically different overall lesion volumes. Similarly, comparison of patients B and C shows how a similar lesion size can produce two markedly different AF-lesion loads and, accordingly, result in very different levels of impairment.

