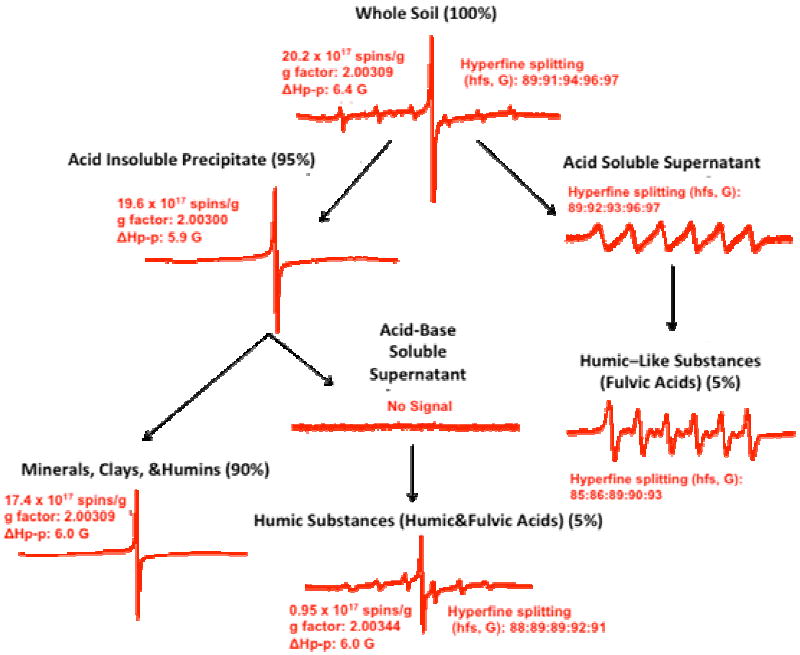
Figure 5.

EPR spectra of various soil fractions of contaminated soils. (Individual spectra are not on the same scales, percentages in parenthesis are the approximate percent mass recoveries of extraction.) Acid-base soluble and acid soluble supernatants are solution spectra and have poorer resolution than the powder spectra of the Humic Substances (HA&FA) and Humic Like Substances (FA) respectively. The remaining figures on the left hand side of the diagram are all powder spectra.
