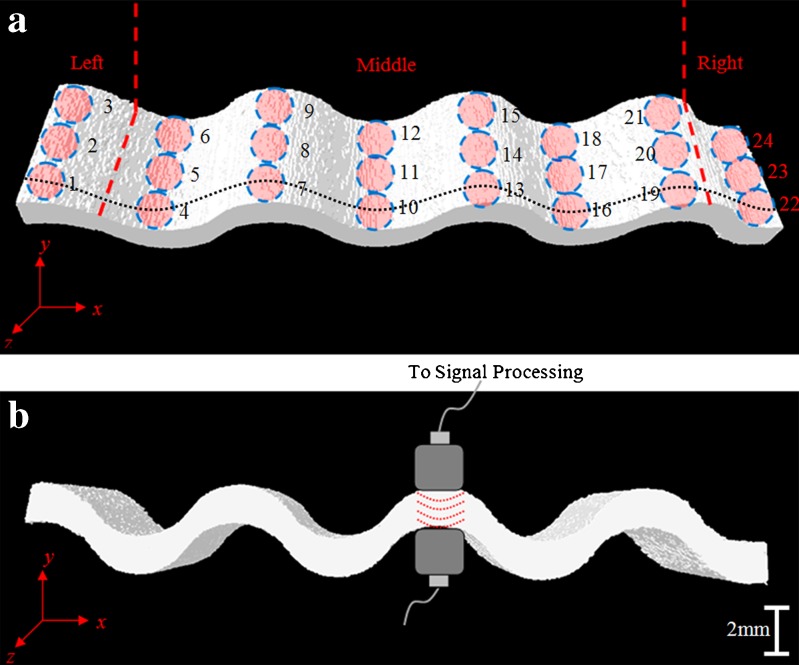
Fig. 3.
Reconstructed X-ray micro-computed tomography images of the actual roller-compacted ribbon with its perspective (a) and side (b) views. Piezoelectric transducers with a diameter of 3 mm are illustrated during a scan operating in pitch-catch mode (b). Dashed circles correspond to the ultrasonically scanned areas (a) (Left: 1, 2, 3–Middle: 4–21–Right: 22, 23, 24). a Dotted line represents the X-ray micro-computed tomography cross-section image in Fig. 10. The ribbon thickness is measured as 2 ± 0.2 mm (x = width, y = thickness, z = length)

