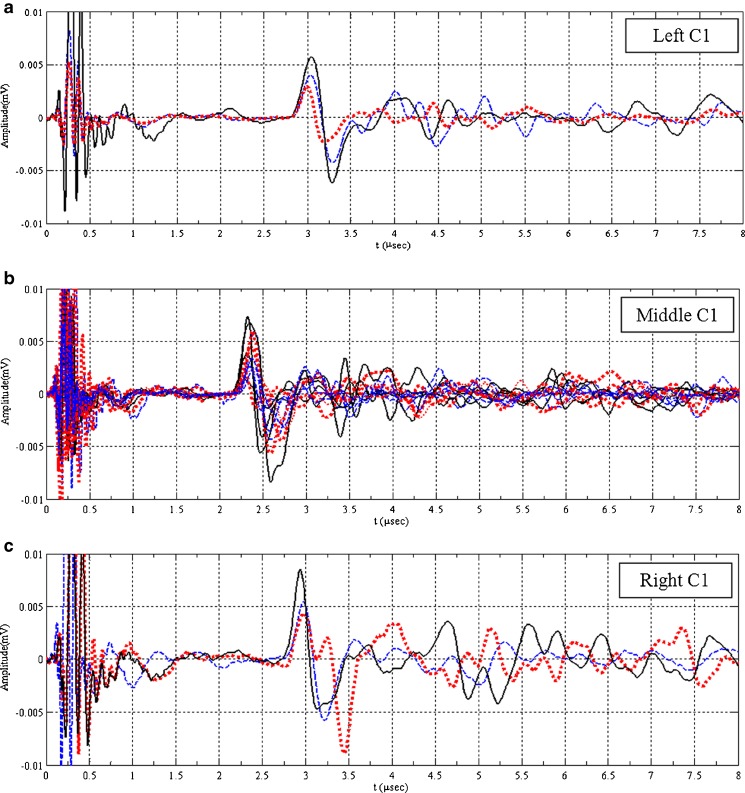
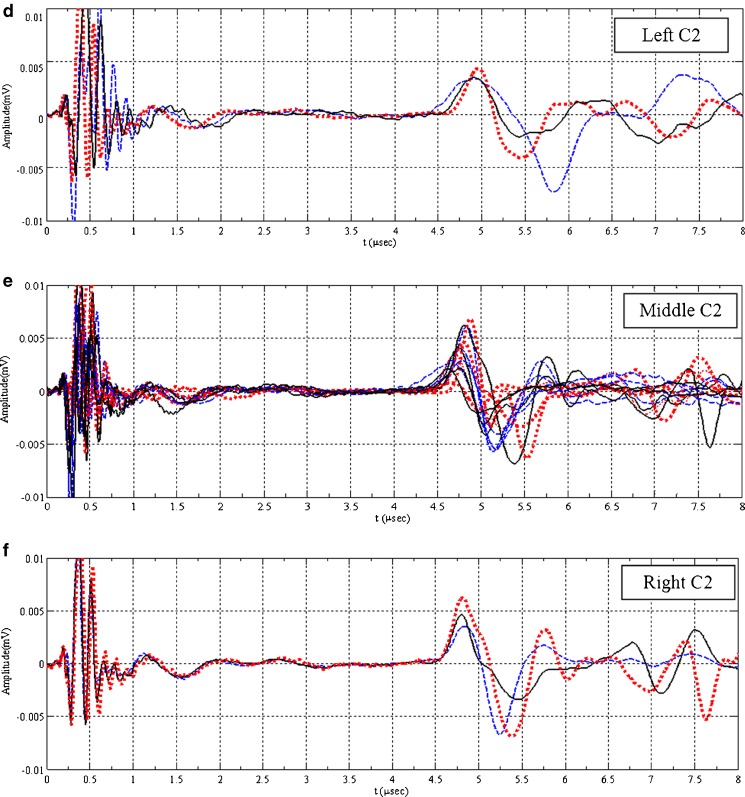
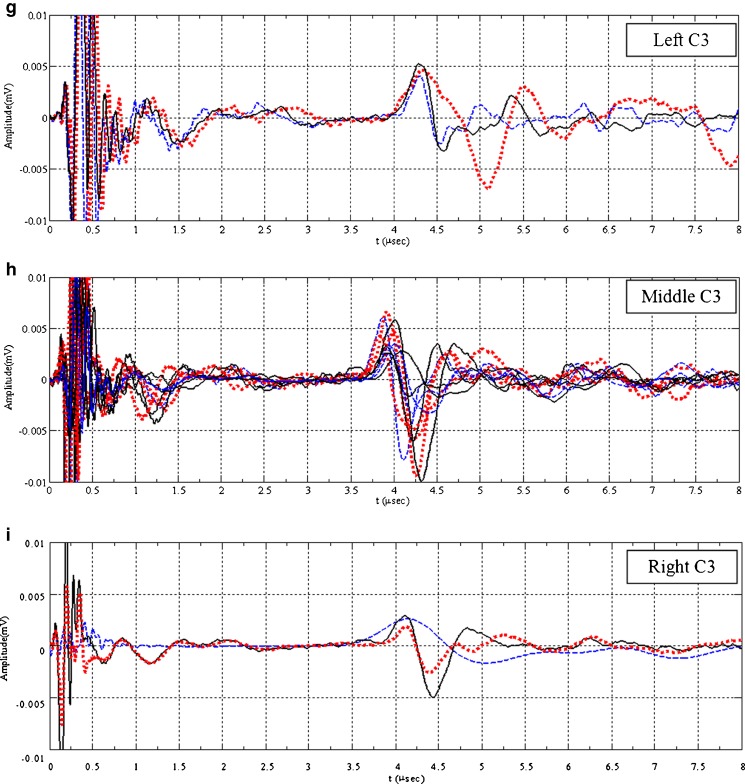
Fig. 7.
Longitudinal (pressure) acoustic waveforms for the ribbons obtained in case 1 (a–c), case 2 (d–f), and case 3 (g–i). Dashed, solid, and dotted waveforms correspond to the ultrasonically scanned points as the first (1, 4, 7, 10, 13, 16, 19, 22); middle (2, 5, 8, 11, 14, 17, 20, 23); and the last (3, 6, 9, 12, 15, 18, 21, 24) rows on the ribbon in the z-direction (i.e., along the length of the ribbon), respectively


