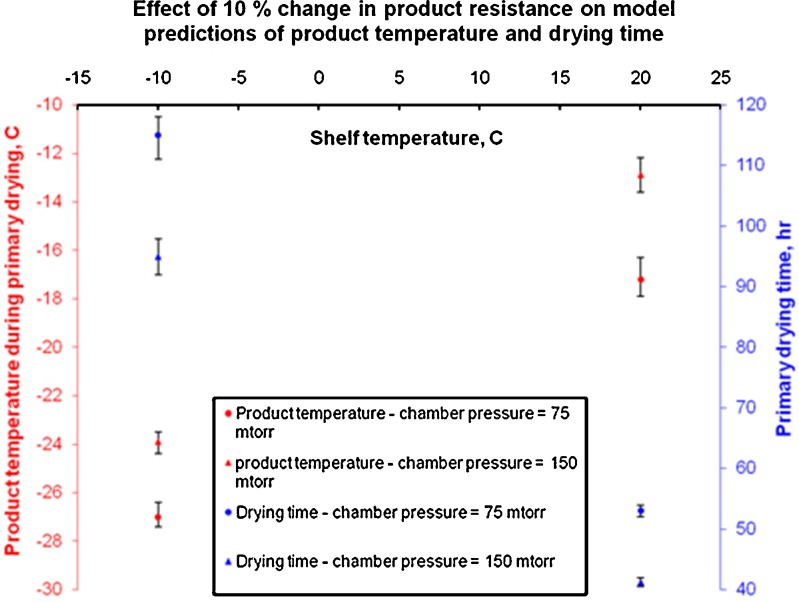
Fig. 6.
Plot showing the effect of a 10% error in measurement of Rp on product temperature and drying time predictions during primary drying. Error bars represent changes in primary drying temperature and drying time when product resistance changes by 10%. Primary drying time is plotted on right y-axis and product temperature during drying is plotted on left y-axis

