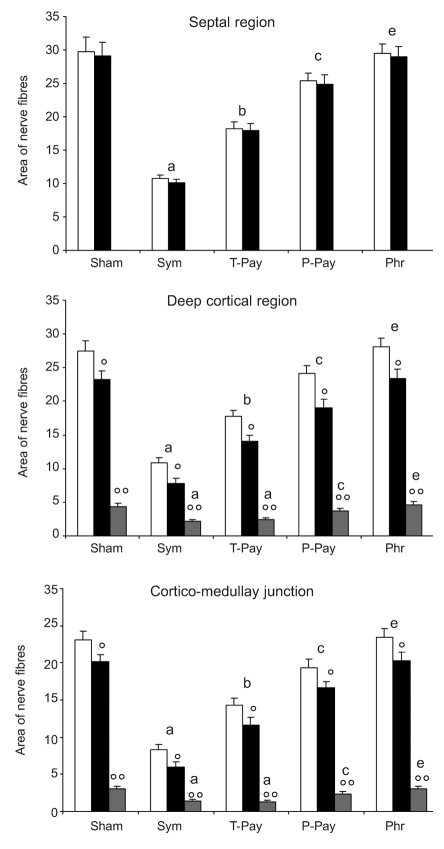
Figure 4.
Analysis of regions in which thymus lobule has been subdivided (see Materials and Methods section for detail). Bar graph showing morphometric analysis of nerve fibers running along vessels and branching into the parenchyma. Data are reported as Figure 1. White bar: total nerve fibers; Black bar: perivascular fibers; Grey bar: intraparenchymal fibers. Legend of statistical significance as in Figure 1.

