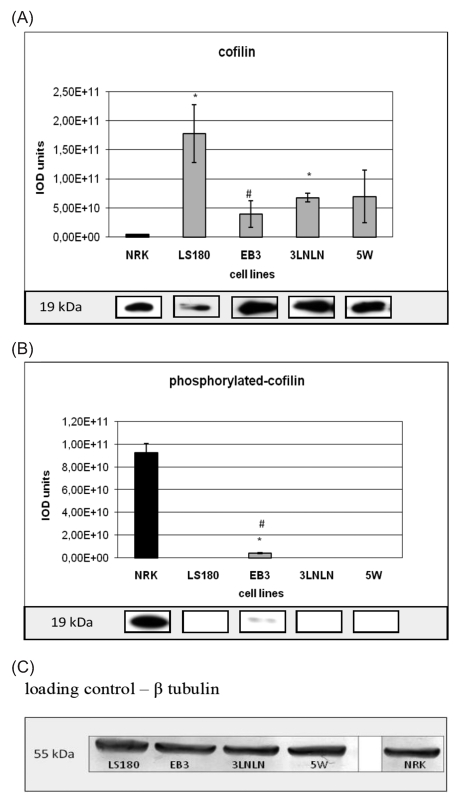
Figure 2.
The level of cofilin (A) and P-cofilin (B) in the cytosolic fractions from colon adenocarcinoma cell variants and normal NRK cells. SDS/PAGE and Western blotting with antibodies recognizing the examined proteins (see Materials and Methods) followed by densitometric analysis were used. Thirty µg of protein was applied in each case. Bars represent the mean from three independent experiments, each performed in triplicate (± SD). Results are expressed as units of integrated optical density (IOD). The statistical significance of the differences was confirmed by Student's t-test, P<0.05; *indicates values significantly different from those for normal NRK cells; #indicates values significantly different for human adenocarcinoma sublines in comparison with parental LS180 cells. The examples of a single representative immunoblotting reaction for each cell line are shown in the inserts. β-tubulin was used as the loading control during all Western blotting experiments (representative immunoblot - C).

