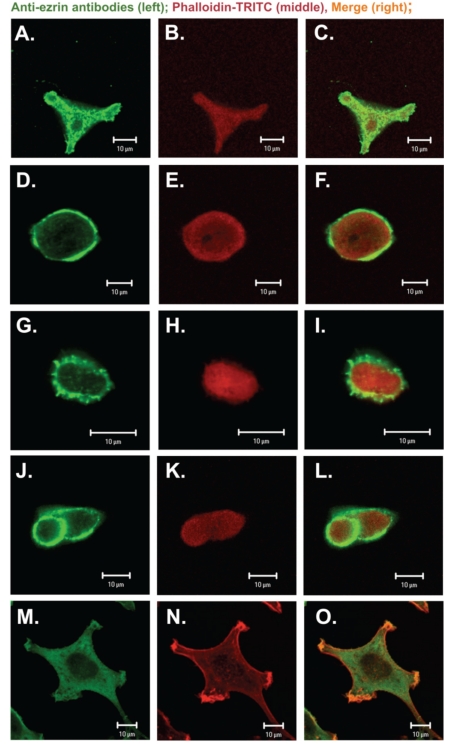
Figure 5.
Ezrin location in colon adenocarcinoma sublines with different metastatic potential. (A–C) parental LS180 cells; (D–F) EB3; (G–I) 3LNLN; (J–L) 5W and (M–O) NRK cells. Scale bar: 10 µm. Left panel (green): immunostaining with antibodies against ezrin conjugated with Alexa Fluor 488; middle panel (red): actin – visualized by TRITC-conjugated phalloidin; right panel: merge.

