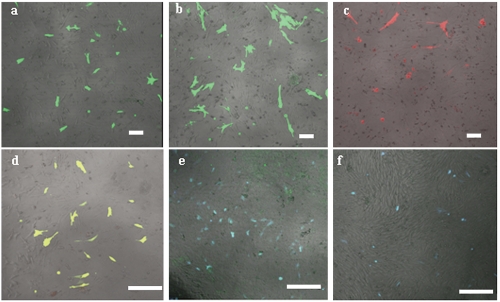
Figure 6.
Comparison of six fluorescent proteins at 24 h after transfection using a confocal microscope with excitation wavelengths of 433 nm-588 nm to determine the transfection 0efficiencies. (a to f) were the transfection results of pEGFP-C1, pEGFP-N3, pDsRed1-N1 pEYFP-N1, pECFP-N1and pECFP-mito respectively.

