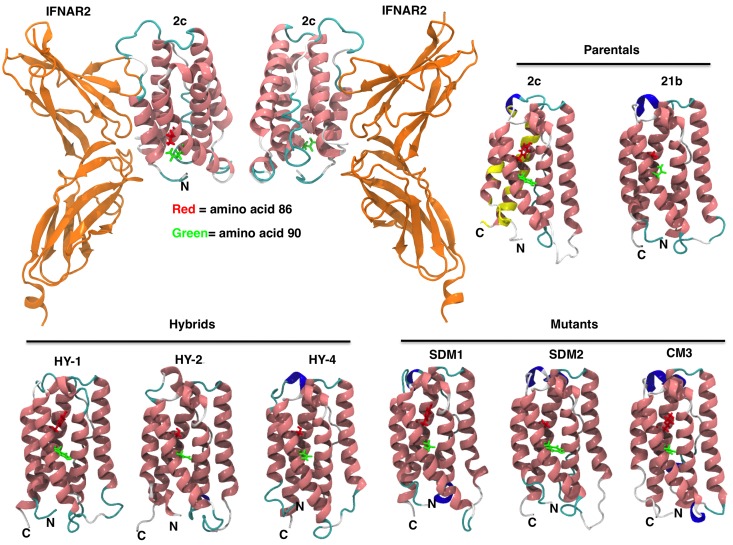
Figure 3.
IFNα constructs 3-D models. IFN homology models for parental IFN (IFNα2c and IFNα21b), hybrids, and mutants were generated as described in “Homology modeling.” The ribbon diagram renderings of IFN homology models are colored by secondary structure (pink = α helix, blue = 310 helix, cyan = turn, white = coil). Mutations in the C-loop of the molecule in amino acid positions 86 and 90 are shown in red and green, respectively. Overall the structures are very similar with the mean root mean square deviation (RMSD) between the C-α carbons being 2.5 Å (median RMSD = 2.4 Å). Most of the structural differences between the models occur in loop regions, specifically positions 21-31, 45-51, and 100-110. Docking of IFN-binding ectodomain of the homology model of IFNα2c to IFNAR2 is shown (top left panel). Yellow color on IFNα2c model illustrates IFNAR2 interacting region (top right panel). Coloring on secondary structure was performed using Visual Molecular Dynamics (VMD) program.

