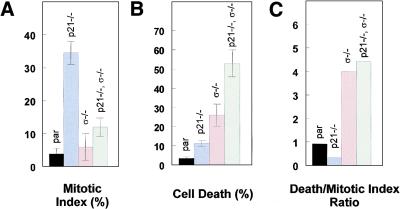
Figure 5.
Distinct functions of p21 and 14-3-3ς following DNA damage. (A) Cells of the indicated genotypes were treated with 0.2 μg/ml adriamycin for 12 hr and subsequently with colcemid for 20 hr. The y-axis corresponds to the percentage of cells in mitosis (mitotic index). Error bars correspond to one standard deviation; the bars represent the means determined from at least three independent experiments. (B) Cells were treated as in A and cell death was scored. The y-axis corresponds to percentage of dead cells. (C) Cells were treated as in A. The y-axis corresponds to the ratio between the fraction of dead cells to the fraction of cells arrested in mitosis.

