Figure 1.
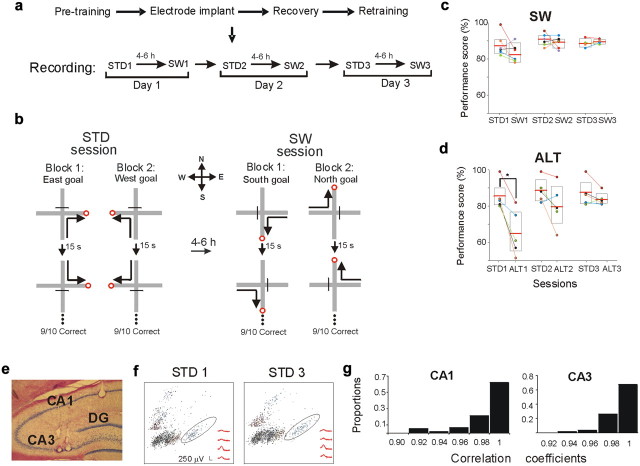
Experimental design, performance, and recording stability. a, The recording protocols of the SW and ALT tasks (data not shown) were identical. b, Rats were trained in a spatial win-stay task with serial reversals on a plus maze. In the familiar STD session rats performed 10 trials of each of four possible journeys (north to west, south to west, north to east, and south to east). In the SW task, rats completed east to south, west to south, east to north, and west to north journeys using the same standard protocol. c, SW performance. Each color-coded circle represents the score of an individual rat. Boxes represent 95% confidence intervals. Horizontal lines are the mean. Lines connect scores of individuals between sessions. The SW task was learned to criterion in 11.5 trials (STD1 = 10 trials, p = 0.3; mean score: STD1 = 87%, SW1 = 83%, p = 0.2). d, During ALT1, mean performance decreased significantly, but recovered the next day (trials to criterion: ALT1 = 41, STD1 = 10, p = 0.005; mean score: STD1 = 85%, ALT1 = 65%, p = 0.02; STD2 = 88%, ALT2 = 80%, p = 0.2). e, The representative coronal section shows a simultaneous placement of tetrodes in CA1 and CA3. f, Cluster-waveform maps of CA1 cells recorded in the first and last STD session demonstrate the stability of recording location. The clusters surrounded by an ellipse contain the waveforms shown in the bottom right. g, Recording stability was further determined by calculating the correlation coefficient between the average waveforms recorded during the first and last recording sessions (see Materials and Methods). The graphs show the distribution of waveform correlation coefficients between all recorded cells, in CA1 and CA3, respectively. Waveforms were highly correlated (all r > 0.9), demonstrating high stability.

