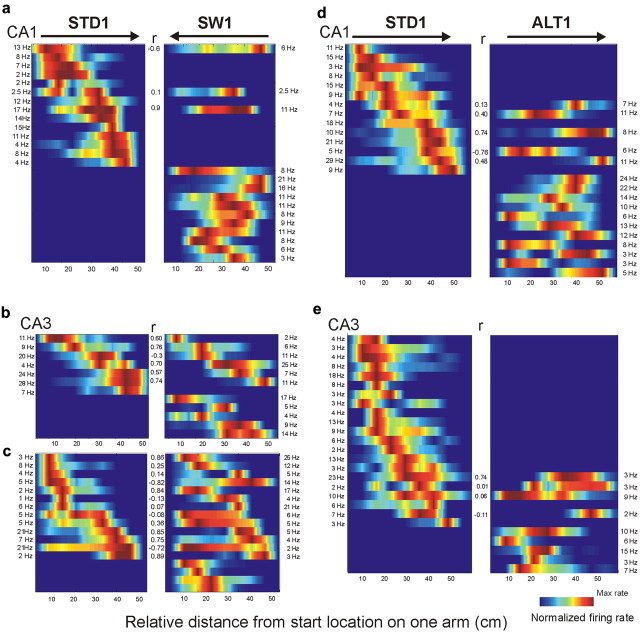
Figure 2.
Firing-rate maps of CA1 and CA3 cells during STD, SW, and ALT tasks. Each panel shows the firing rates of simultaneously recorded neurons. The colored horizontal bars within a panel show the firing-rate distribution of an individual cell on one arm, sorted by the maximal firing rate during the STD. Parallel bars in adjacent panels show the activity of the same cells on the same arm in different tasks. Rate maps were smoothed for this figure only, not in statistical analyses. The color code depicts firing rate normalized to each cell's maximal firing rate. Blue areas on the maps represent 0 Hz. The maximal firing rate of each cell is listed at the edge of each panel; Pearson's r is shown in the center. Arrows on top indicate movement direction. a–c, The SW task. Firing-rate maps of CA1 (a) and CA3 (b, c) during STD1 (left panels) and SW1 sessions (right panels). a and b show simultaneous recordings in CA1 and CA3, respectively, from the same rat. c, CA3 cells recorded from a different rat during the SW session. Note the large CA3 subpopulation that remained active on the same arm between STD and SW. d, e, The ALT task. Firing-rate maps of active CA1 (d) and CA3 (e) cells during the STD1 (left) and ALT1 sessions (right). Most CA1 cells were active in a given arm in only one of the tasks. Few CA3 cells were active during the ALT task.

