Figure 3.
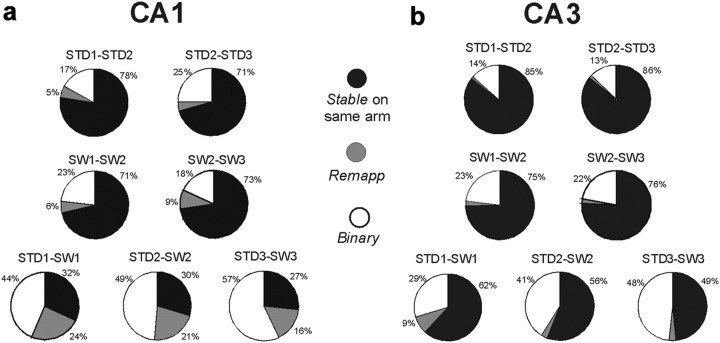
Place-field stability on the same arm between STD and SW sessions. a, b, Categorical analyses of CA1 (a) and CA3 (b) place fields. The pie charts show the distributions of response categories between session pairs (e.g., the STD1-STD2 pie chart in the first row compares between the first and second STD sessions). Response categories were as follows: Stable, cells that maintained a place field on the same arm between sessions; Remap, cells that had a place field in both sessions, but on different arms; Binary, cells that had a place field in only one of the compared sessions. Stable responses were common in both CA1 and CA3 in repeated STD and repeated SW sessions (>70%). Between STD and SW sessions (bottom row), place fields were significantly more stable on the same arm in CA3 compared with CA1. The levels of Stable response category in CA3 decreased between the first and last recording day (62–49%; χ2(1) = 5, p = 0.027).

