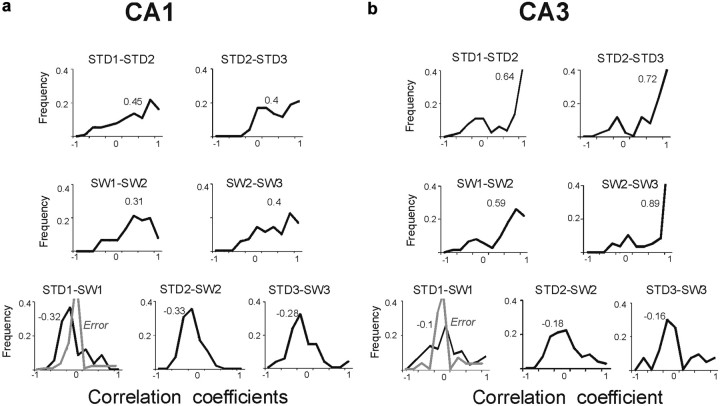
Figure 5.
CA1 population vectors were anticorrelated between STD and SW, whereas CA3 vectors were uncorrelated. a, b, Population vector analyses for CA1 (a) and CA3 (b). The plots show the frequencies of population vector correlations between different sessions. Top row, between repeated STD sessions; middle row, between repeated SW sessions; lower row, between STD and SW sessions. The values above the distributions depict medians. Between STD and SW sessions, CA1 population vectors were more anticorrelated (median = −0.32), compared with CA3 population vectors (median = −0.1). Distributions of correlations during error trials (comparing error SW1 to correct STD1 trials) are marked in gray. In CA1, most correlations between error SW and correct STD trials became less anticorrelated (median was 0). Unlike CA1, CA3 population vector correlations did not distinguish correct from error trials (median correlations were 0 in correct or error trials).

