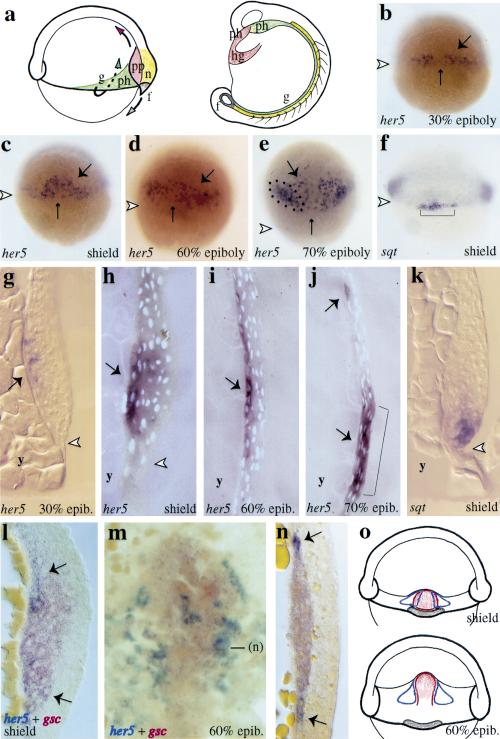
Figure 1.
her5 is expressed in a subset of presumptive endodermal/mesendodermal cells at gastrulation. (a) Simplified fate map of the endoderm and mesendoderm at early gastrulation (from Shih and Fraser 1995; Cooper and D'Amico 1996; Melby et al. 1996; Warga and Nüsslein-Volhard 1999). The presumptive territories at the shield stage (left) and their derivatives at the 15-somite stage (right) (lateral views, dorsal to the right) are color-coded, and cell movements are indicated by arrows. her5 and sqt expression revealed by in situ hybridization (blue) in whole-mount gastrulae (b–f) and on the corresponding parasagittal sections (g–k) at the stages indicated (lower right corner), anterior to the top (white arrowheads point to the blastoderm margin). From 30% epiboly on, her5 (large arrows on b–e,g–j) is expressed in a subpopulation of dorsal deep cells (the small arrow indicates the dorsal midline), it becomes restricted to dorsal endodermal precursors immediately following the shield stage. her5-positive cells are located in direct apposition to the yolk syncitial layer (g–j). From 70% epiboly, her5 expression is also turned on in the presumptive mid-hindbrain (dots in e, bracket in j). At that stage, her5-positive endodermal precursors are restricted to the prechordal embryonic area. At the shield stage, sqt expression selectively labels forerunner cells (brackets in f), and the her5- and sqt-positive domains are adjacent and nonoverlapping (cf. c and f,h and k). her5 (blue) and gsc (red) expression at shield (l) and 60% epiboly (m,n) stages (m, dorsal view, anterior to the top; l,n, sections of the prechordal plate, dorsal to the right; contrary to sections g–k, l and n are cross-sections, oriented vertically). her5 (large arrows) and gsc expression overlap in the lateral aspects of the organizer at the shield stage, but are exclusive by 60% epiboly. In m, the medial her5-expressing cells are located under the gsc-positive prechordal plate. (o) Schematic of the spatial relationship of her5 (open blue domains), gsc (red), and sqt (brown) expression patterns at the shield (top) and 60% epiboly (bottom) stages (dorsal views).(f) forerunner cells and derivatives; (g) gut precursors; (hg) hatching gland; (n) notochord; (ph) pharyngeal precursors; (pp) prechordal plate; (y) yolk.

