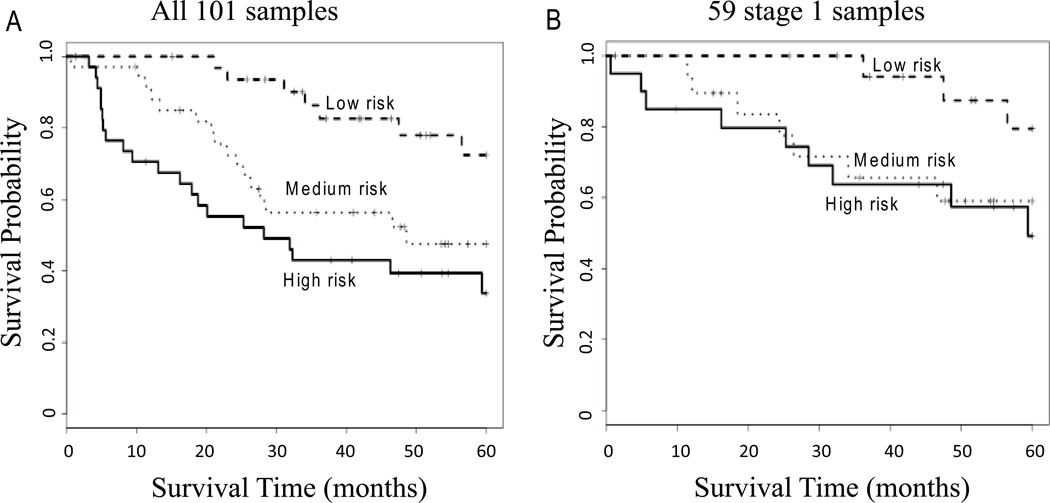
FIGURE 2.
Prediction results of the 91-gene qRT-PCR signature in the 101 samples of validation set. A, Kaplan-Meier survival curve using patient mortality risk index (MRI) from the RSF prediction model built from training set including 91 genes, stage and age. This predictor could significantly separate high, medium and low-risk groups (1/3rd in each group, HR = 1.00, 2.82, 4.42, p = 0.0008) among all 101 patients (A), as well as among the 59 stage 1 patient (1/3rd in each group, HR = 1.00, 3.29, 3.776) (B).

