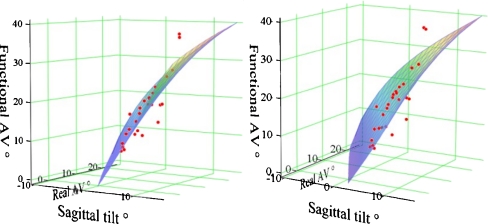
Fig. 4.
Illustration of the mathematical–geometrical correlation between rotatory anteversion (phi), prosthesis tilting in the sagittal plane (eta) and the resulting functional anteversion in a 3D diagram. (Real AV rotatory anteversion). The measured values for the patients are also displayed in the coordinate system (dots) and are approximately in the calculated plane

