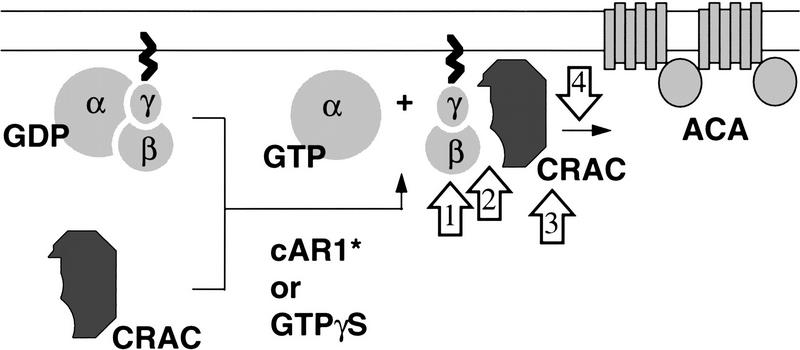
Figure 7.
A schematic model of activation of ACA. The double lines represent the plasma membrane. cAR1* represents the activated surface receptor. Upon receptor or GTPγS activation, CRAC translocates onto the membrane. The binding of CRAC to the membrane is a Gβ-dependent process. Open arrows indicate possible points of action of Pia. See Discussion for details.

