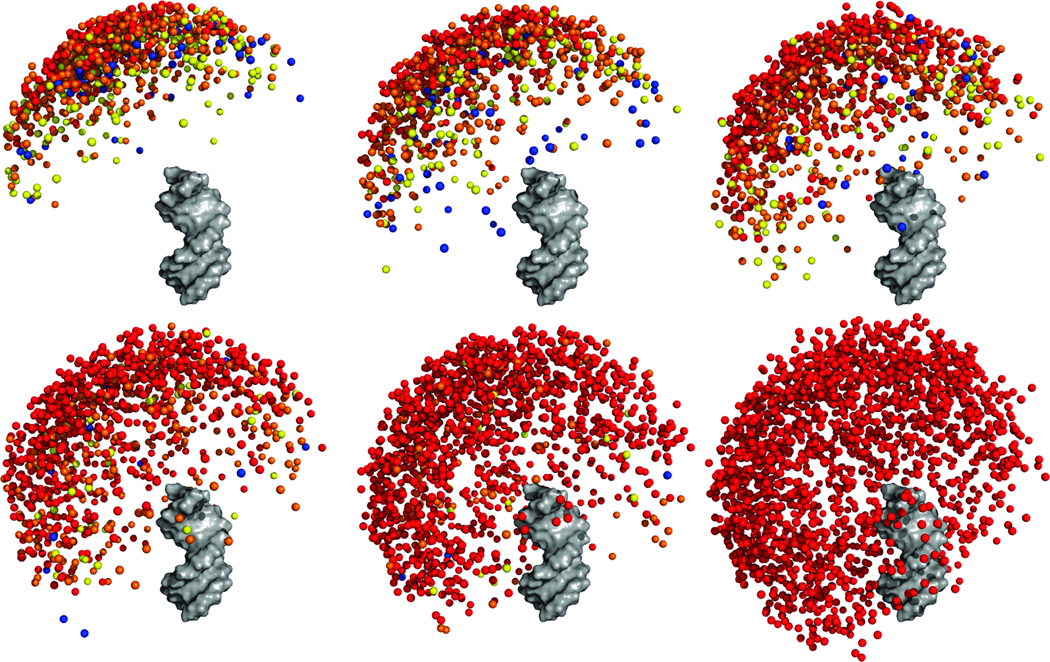
Figure 4.
Visualization of the computationally-derived unfolded ensemble at various ionic conditions. From left to right, top to bottom: 0, 0.04, 0.15, 0.3, 2 M monovalent ions (in 16 mM monovalent background). The last figure shows the ensemble in the absence of electrostatics (i.e., steric effects only). One duplex is rendered in gray while the colored balls represent the distal end of the other duplex. Colors represent the energetic difference between the conformer and the minimum-energy conformer observed in the ensemble. Red, 0 – 1 kBT; Orange, 1 – 2kBT; Yellow, 2 – 3 kBT; Blue, > 3 kBT. The representation of each duplex by a single point occasionally results in the juxtaposition of a high-energy conformer close to a low-energy one; these cases correspond to conformers whose distal ends are in close proximity to low-energy conformers, but whose orientations (hidden in this representation) are energetically unfavorable (e.g., stretch the PEG tether unfavorably).

