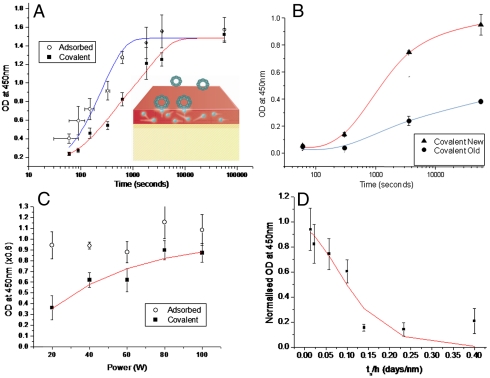
Fig. 4.
Testing the predictions of the radical model against ELISA immobilization data. The model is illustrated schematically in the Inset. (A) The dependence of tropoelastin coverage on incubation time for PIII-treated PTFE. The lines show the fits of Eqs. 2 and 3 to the amounts adsorbed and covalently immobilized. (B) The time constant for covalent immobilization increases with sample age. (C) Tropoelastin physisorbed (open circles) and covalently bound (closed circles) to polystyrene treated for 10 s in nitrogen (2 mtorr) plasma discharges created at various rf plasma powers as indicated. The red line shows the fit of Eq. 4 with fitting parameter D = 0.0034 ± 10%. (D) Tropoelastin covalent binding to acetylene plasma-deposited layers of varying thickness on stainless steel sheet. The data are plotted against the independent variable time since deposition divided by layer thickness. The data, taken from two assays, is normalized to the average amount adsorbed. The red line shows the fit to Eq. 5 with fitted parameters B = 0.065 ± 0.019 d/nm and C = 976 ± 391 s.

