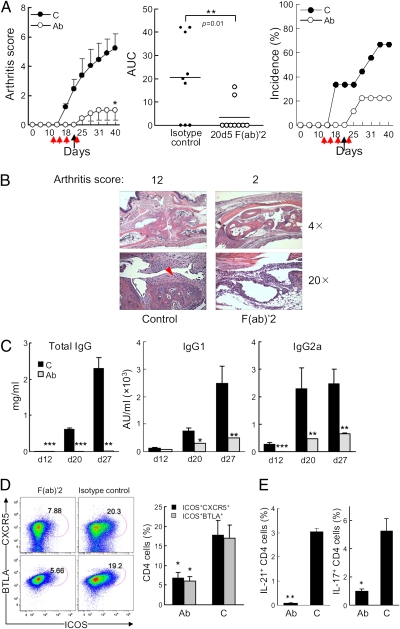
Fig. 4.
The efficacy of anti-NKG2A F(ab)′2 treatment of CIA. (A Left) CIA was induced in B6.WT mice as described in Materials and Methods. 200 μg of 20d5 F(ab)′2 anti-NKG2A (Ab) or 2A3 F(ab)′2 isotype control Ab (C) was given i.p. at the indicated times (red arrows: d 12, 15, 18, and 22; black arrows indicate CII boost). n = 9 mice per group; Student's t test: *P = 0.02 of two groups. (Center) Area under the curve (AUC) of individual mouse in A Left from the outset of treatment (**P < 0.01, Mann-Whitney test). (Right) Disease incidence is shown. Data represent at least five independent experiments. (B) Representative images of joint histology are shown. Red arrowhead indicates pannus formation. (C) Serum titers of anti-chicken CII IgG, IgG1, and IgG2a are shown. ***P < 0.001; **P < 0.01. (D Left) Representative plots of TFH cells from nondLNs are shown. Comparisons are made between F(ab)′2-treated and control-treated mice. (Right) Statistical analyses are shown. n = 5 (isotype control) and n = 4 [F(ab)′2]; Student's’ t test: *P < 0.05. (E) Levels of intracellular IL-17 and -21 in total CD4 cells from nondLNs were compared and graphed. n = 5 (isotype control) and n = 4 [F(ab)′2]; Student's’ t test: *P < 0.05.

