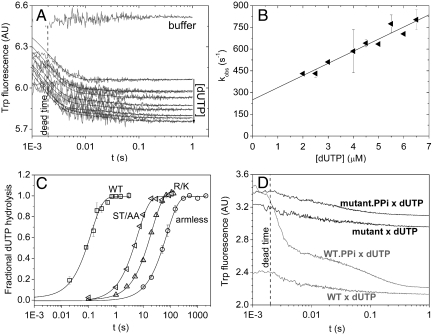
Fig. 3.
Transient kinetic analysis of the mutants, (A and B) show stopped-flow experiments of hDUTAST/AA binding to dUTP. (A), Fluorescence time courses recorded upon the initial binding phase of the reaction of various concentrations of dUTP with 0.8 μM hDUTST/AA. Smooth lines are the best double exponential fits to the experimental curves. The first exponential (fast phase with 95–98% of the total amplitude) is analyzed in (B). The second exponential of small amplitude did not depend on concentration and yielded kISO = 29 ± 5 s-1 (SD for n = 10). (B), Concentration dependence of the observed rate constant of the fast phase. The linear fit yielded a second-order binding rate constant of 84 ± 8 μM-1 s-1 and a dissociation rate constant of 250 ± 36 s-1. Errors represent SD for n = 20. (C), Single turnover γ32P-dUTP hydrolysis by the WT and mutant dUTPases measured using the quench-flow technique. 25 μM protein was mixed with 12.5 μM γ32P-dUTP and the reaction was followed till completion. Each curve was fitted with single exponentials yielding hydrolysis rate constants of 5.5 ± 2.5 s-1 for WT (squares), 0.16 ± 0.01 s-1 for hDUTST/AA (left-pointing triangles), 0.048 ± 0.001 s-1 for hDUTR/K (triangles), and 0.01 ± 0.001 s-1 for hDUTarmless (circles). Errors represent SD for n = 3. (D), Time courses of PPi dissociation from the WT and hDUTST/AA was measured by dUTP chasing in the stopped-flow. 4 μM enzyme or its preequilibrated complex with 2 mM PPi was mixed with 1 mM dUTP. The fast phase of the dUTP binding reaction is lost in the dead-time as expected (13). In the chasing reaction, PPi dissociation limits the rate of dUTP binding which can be followed in case of the WT enzyme (gray lines) while no PPi dissociation can be observed in the mutant (black lines). WT and hDUTST/AA curves are shifted on the y-axis compared to each other for better viewing.

