Fig. 5.
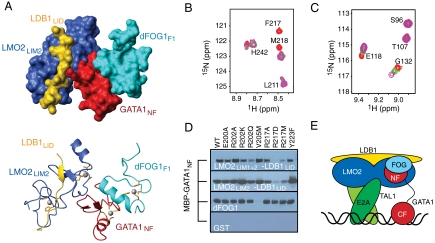
FOG1 and LMO2-LDB1 simultaneously bind GATA1NF in vitro. (A) Surface and ribbon diagrams of a data-driven model of LMO2LIM2-LDB1LID/GATA1NF/dFOGF1 complex. LMO2LIM2 is in blue, LDB1LID in gold, GATA1NF in red, and dFOGF1 in cyan. Zn-coordinating residues are orange sticks and Zn(II) ions are gray spheres. (B) A portion of the 15N-HSQC spectrum of 15N-dFOGF1 alone (red), following addition of GATA1NF (green) and after further addition of LMO2LIM2-LDB1LID (purple). The initial concentration of 15N-dFOG1 was 220 μM. (C) A portion of the 15N-HSQC spectrum of 15N-LMO2LIM2-LDB1LID alone (red), following addition of 1 M equivalent of GATA1NF (green) and following the further addition of 1 M equivalent of dFOGF1 (purple). (D) GST-pulldown assays in which MBP-GATA1NF was pulled down by resin-bound GST-LMO2LIM1+2-LDB1LID (Top), GST-LMO2LIM2-LDB1LID (Second Top), GST-dFOGF1 (Second Bottom) or GST (Bottom). Binding was detected by Western blot using anti-MBP antibodies. (E) Schematic of a LMO2 (blue)/LDB1 (yellow)/TAL1(dark green)/E2A (light green)/GATA1 (red)/FOG1 (light blue) complex bound to DNA (black).

