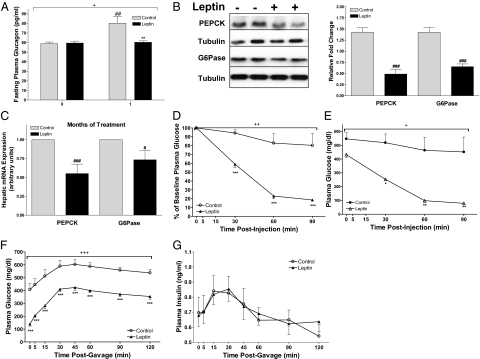
Fig. 2.
Chronic leptin treatment improves glucose homeostasis and insulin sensitivity. (A) Fasting plasma glucagon (13-h fast) at 1 mo after initiation of leptin treatment (n = 11 per group). (B and C) Hepatic PEPCK and G6Pase protein (B) and mRNA expression (C) at 1 mo after initiation of leptin treatment (n = 11 per group). (D and E) Percentage of baseline plasma glucose (D) and plasma glucose concentrations (E) during an ITT preformed 2 wk after the initiation of leptin treatment (n = 3 per group). Animals were fasted for 4 h and then injected with 1 U/kg regular insulin. (F and G) Glucose (F) and insulin (G) during an OGTT at 1 mo after initiation of leptin treatment (n = 11 per group). Animals were fasted overnight and gavaged with 1 g/kg of glucose. +P < 0.05, ++P < 0.01, and +++P < 0.001 by two-way ANOVA; *P < 0.05, **P < 0.01, and ***P < 0.001 compared with control by Bonferroni's posttest; and #P < 0.05, ##P < 0.01, and ###P < 0.001 by Student's t test. Values are expressed as mean ± SEM.

