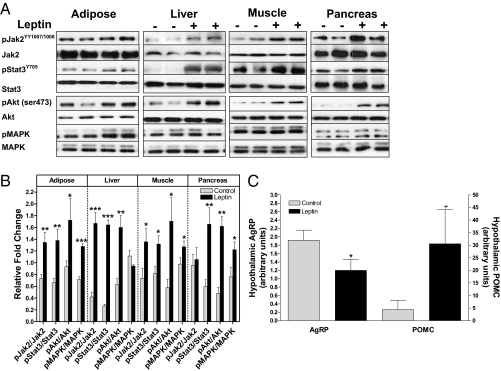
Fig. 3.
Chronic leptin treatment up-regulates the leptin and insulin signaling pathways. Rats received their final injection and were fasted overnight, and tissues were collected the following day. (A) Immunoblotting for phosphorylated (pJak2) and total Jak2, phosphorylated (pSTAT3) and total STAT3 (Upper), phosphorylated (pAkt) and total Akt, and phosphorylated (pMAPK) and total MAPK (Lower) in adipose, liver, muscle, and pancreas tissue. (B) All blots were scanned and quantified with FluorChem 9900. Results were quantified in densitometric units and expressed relative to the total protein of interest. (C) Hypothalamic mRNA expression of AgRP and POMC. *P < 0.05, **P < 0.01, ***P < 0.001, and +P = 0.055 compared with control by Student's t test. (n = 6 per group for immunoblots; n = 4 per group for hypothalamic mRNA.) Values are expressed as mean ± SEM. Bar graphs represent normalized data.

