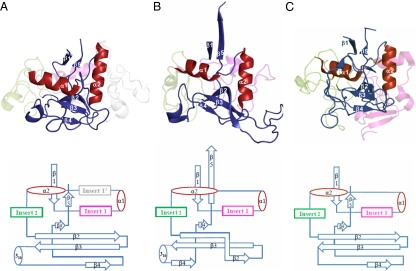
Fig. 2.
The FGE-type CLec fold of TvpA. Ribbon representation (Top; β-strands in blue and α-helices in red) and topology diagram (Bottom) of the CLec fold in (A) TvpA (2Y3C), (B) Mtd (1YU0), and (C) hFGE (2HI8). Disulfide bonds in hFGE are displayed as sticks. For clarity, inserts are ghosted, the β-flap of TvpA is not shown, and only the C-terminal domain of Mtd is displayed.

