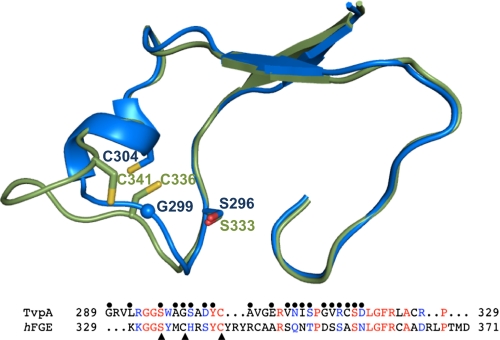
Fig. 4.
Relationship to FGE. Superposition of the VR of TvpA (blue) and the catalytic site of hFGE (green) in Cα representation. Bottom: Sequence alignment of the regions shown above. TvpA variable residues denoted by spheres and hFGE catalytic residues by arrows. Identical residues are in red, and chemically similar ones in blue.

