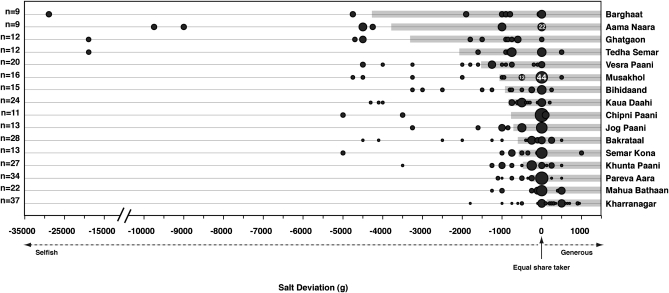
Fig. 2.
Distributions of salt deviations (amount available per person − amount taken) across 16 villages. For each village on the y axis, the areas of the black bubbles represent the proportion of individuals from the village with salt deviation of the value on the x axis. Note the break in the x axis. To indicate scale, the numbers in some bubbles are the percentage proportions represented by those bubbles. Gray horizontal bars indicate the mean salt deviations for villages. Villages are ordered by their mean salt deviations; the bottom village (Kharranagar) has the highest mean. The dashed line below the x axis marks whether a value of salt deviation indicates an “equal share taker” (salt taken = amount available per person), a “selfish” individual (salt taken > amount available per person), or a “generous” individual (salt taken < amount available per person). Counts on the left (n) represent the number of salt takers from each village (total n = 302). The overall mode across villages is 0 g (mean ± SD = −913.33 ± 2,619.02).

