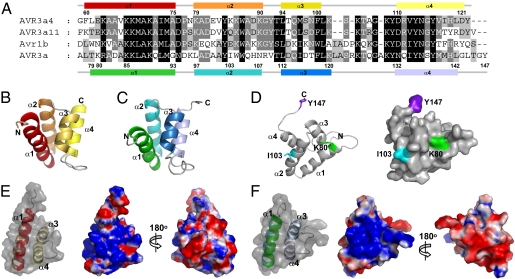
Fig. 1.
Structural analysis of AVR3a4 and AVR3a. (A) Multiple sequence alignment of the effector domain of Phytophthora AVR3a and homologs. AVR3a4 and AVR3a11 are from P. capsici, Avr1b is from P. sojae, and AVR3a is from P. infestans. The helical regions and corresponding amino acid positions for AVR3a4 are shown above the alignment and for AVR3a are shown below the alignment. (B and C) Ribbon diagrams of the structures of (B) AVR3a4 and (C) AVR3a. (D) The important residues for R3a recognition (K80, green; I103, cyan) and INF1-induced cell death (Y147, purple) are mapped on the ribbon diagram (Left) and the surface structure (Right) of AVR3a. (E and F) Surface charge distribution of (E) AVR3a4 and (F) AVR3a. Electrostatic potential was calculated with PyMol (DeLano Scientific). Positively and negatively charged surfaces are shown in blue and red, respectively.

