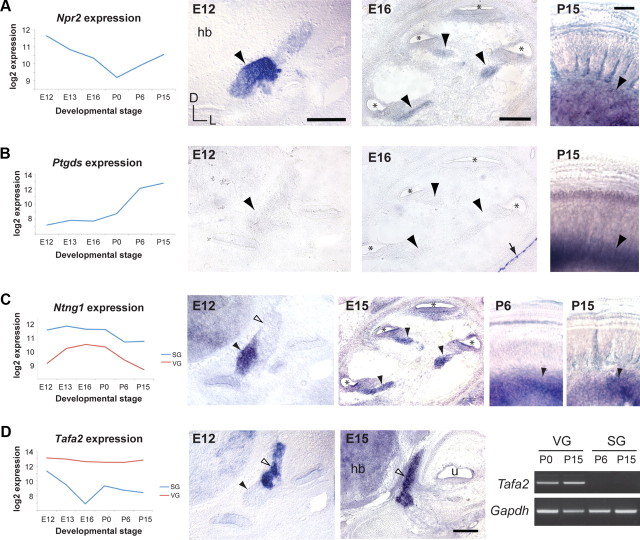
Figure 5.
Validation of spatiotemporal gene expression profiles. Genes with temporal (A, B) or spatial (C, D) differences in expression were selected from the signature gene list and confirmed by in situ hybridization (A–D) or RT-PCR (D) at the stages indicated. Gene expression profiles are plotted as in Figure 3. E12, E15, and E16 embryos were sectioned transverse to the ear; mid-modiolar sections are shown for E15 and E16. P6 and P15 cochleae were processed for whole-mount in situ hybridization and flat mounted, with the SG at the bottom and the organ of Corti at the top. In all panels, the SG is indicated by black arrowheads and the VG by open arrowheads. The arrow in B indicates positive signal for Ptgds outside of the ear, confirming that the experiment was successful. For the RT-PCR, Gapdh was used as a positive control to confirm the presence of cDNA. D, Dorsal; L, lateral; *, cochlear duct; hb, hindbrain; u, utricle. Scale bars: (A) 100 μm for E12 and E16, 20 μm for P15; (D) 50 μm.

